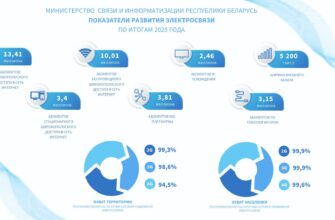
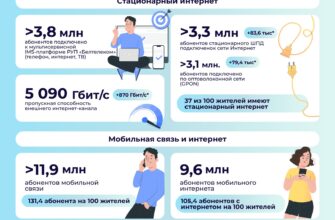
Интересные цифры по проникновению интернета и ШПД.
Percentage of households with internet access or broadband connections
|
||||||||||||||||||
|
EU27 |
54 |
60 |
65 |
42 |
49 |
56 |
||||||||||||
|
Belgium |
60 |
64 |
67 |
56 |
60 |
63 |
||||||||||||
|
Bulgaria |
19 |
25 |
30 |
15 |
21 |
26 |
||||||||||||
|
Czech Rep. |
35 |
46 |
54 |
28 |
36 |
49 |
||||||||||||
|
Denmark |
78 |
82 |
83 |
70 |
74 |
76 |
||||||||||||
|
Germany |
71 |
75 |
79 |
50 |
55 |
65 |
||||||||||||
|
Estonia |
53 |
58 |
63 |
48 |
54 |
62 |
||||||||||||
|
Ireland |
57 |
63 |
67 |
31 |
43 |
54 |
||||||||||||
|
Greece |
25 |
31 |
38 |
7 |
22 |
33 |
||||||||||||
|
Spain |
45 |
51 |
54 |
39 |
45 |
51 |
||||||||||||
|
France |
49 |
62 |
63 |
43 |
57 |
57 |
||||||||||||
|
Italy |
43 |
47 |
53 |
25 |
31 |
39 |
||||||||||||
|
Cyprus |
39 |
43 |
53 |
20 |
33 |
47 |
||||||||||||
|
Latvia |
51 |
53 |
58 |
32 |
40 |
50 |
||||||||||||
|
Lithuania |
44 |
51 |
60 |
34 |
43 |
50 |
||||||||||||
|
Luxembourg |
75 |
80 |
87 |
58 |
61 |
71 |
||||||||||||
|
Hungary |
38 |
48 |
55 |
33 |
42 |
51 |
||||||||||||
|
Malta |
54 |
59 |
64 |
44 |
55 |
63 |
||||||||||||
|
Netherlands |
83 |
86 |
90 |
74 |
74 |
77 |
||||||||||||
|
Austria |
60 |
69 |
70 |
46 |
54 |
58 |
||||||||||||
|
Poland |
41 |
48 |
59 |
30 |
38 |
51 |
||||||||||||
|
Portugal |
40 |
46 |
48 |
30 |
39 |
46 |
||||||||||||
|
Romania |
22 |
30 |
38 |
8 |
13 |
24 |
||||||||||||
|
Slovenia |
58 |
59 |
64 |
44 |
50 |
56 |
||||||||||||
|
Slovakia |
46 |
58 |
62 |
27 |
35 |
42 |
||||||||||||
|
Finland |
69 |
72 |
78 |
63 |
66 |
74 |
||||||||||||
|
Sweden |
79 |
84 |
86 |
67 |
71 |
80 |
||||||||||||
|
United Kingdom |
67 |
71 |
77 |
57 |
62 |
69 |
||||||||||||
|
Croatia |
41 |
45 |
50 |
23 |
27 |
39 |
||||||||||||
|
Former Yug. Rep. of Macedonia |
: |
29 |
42 |
: |
23 |
34 |
||||||||||||
|
Turkey |
20 |
: |
: |
17 |
: |
: |
||||||||||||
|
Iceland |
84 |
88 |
90 |
76 |
83 |
87 |
||||||||||||
|
Norway |
78 |
84 |
86 |
67 |
73 |
78 |
||||||||||||
|
Serbia |
26 |
: |
37 |
7 |
: |
23 |
||||||||||||
: Data not available
U se of the internet by individuals, 2009 (%)
|
|||||||||||||||
|
EU27 |
73 |
48 |
37 |
40 |
34 |
||||||||||
|
Belgium |
77 |
56 |
36 |
41 |
30 |
||||||||||
|
Bulgaria |
63 |
31 |
5 |
5 |
4 |
||||||||||
|
Czech Rep. |
62 |
34 |
24 |
27 |
21 |
||||||||||
|
Denmark |
88 |
72 |
64 |
66 |
61 |
||||||||||
|
Germany |
80 |
55 |
56 |
60 |
53 |
||||||||||
|
Estonia |
88 |
54 |
17 |
16 |
17 |
||||||||||
|
Ireland |
58 |
40 |
37 |
37 |
36 |
||||||||||
|
Greece |
57 |
27 |
10 |
13 |
7 |
||||||||||
|
Spain |
68 |
39 |
23 |
26 |
20 |
||||||||||
|
France |
69 |
50 |
45 |
46 |
43 |
||||||||||
|
Italy |
70 |
40 |
12 |
16 |
9 |
||||||||||
|
Cyprus |
61 |
34 |
16 |
20 |
13 |
||||||||||
|
Latvia |
83 |
47 |
19 |
19 |
19 |
||||||||||
|
Lithuania |
82 |
43 |
8 |
9 |
8 |
||||||||||
|
Luxembourg |
83 |
71 |
58 |
65 |
52 |
||||||||||
|
Hungary |
74 |
46 |
16 |
17 |
15 |
||||||||||
|
Malta |
81 |
45 |
34 |
39 |
29 |
||||||||||
|
Netherlands |
90 |
73 |
63 |
66 |
59 |
||||||||||
|
Austria |
70 |
48 |
41 |
46 |
36 |
||||||||||
|
Poland |
77 |
39 |
23 |
26 |
21 |
||||||||||
|
Portugal |
71 |
33 |
13 |
15 |
11 |
||||||||||
|
Romania |
41 |
19 |
2 |
2 |
2 |
||||||||||
|
Slovenia |
82 |
47 |
24 |
25 |
23 |
||||||||||
|
Slovakia |
78 |
49 |
28 |
29 |
27 |
||||||||||
|
Finland |
87 |
68 |
54 |
54 |
53 |
||||||||||
|
Sweden |
87 |
73 |
63 |
65 |
61 |
||||||||||
|
United Kingdom |
83 |
60 |
66 |
70 |
62 |
||||||||||
|
Croatia |
73 |
37 |
10 |
11 |
9 |
||||||||||
|
Former Yug. Rep. of Macedonia |
69 |
37 |
3 |
3 |
2 |
||||||||||
|
Iceland |
94 |
82 |
44 |
45 |
42 |
||||||||||
|
Norway |
89 |
76 |
70 |
74 |
65 |
||||||||||
|
Serbia |
36 |
25 |
5 |
6 |
3 |
||||||||||
Источник:
http://europa.eu/rapid/pressReleasesAction.do?reference=STAT/09/176&format=HTML&aged=0&language=EN&guiLanguage=en